Ferritin and vitamin B12 reference intervals: a modified Hoffmann’s approach
Establishing defined reference intervals in the laboratory can prove difficult. Here, Agata Sobczyńska-Malefora, Nadia Munim, Martin Crook, Dominic Harrington and Alexander Katayev provide some guidance.
Age and/or gender-specific population-based reference intervals (RIs) are rarely available or are difficult to establish in clinical laboratories. With an increased focus on the between-method standardisation and harmonisation of test results, the development of universal RIs for standardised and harmonised assays may help laboratories to improve patient care.
Both serum ferritin and serum vitamin B12 concentrations vary with age and gender, yet unified RIs are often applied. Both lower and upper limits for these markers are clinically important, as low values suggest deficiency leading to anaemia, and high values may reflect iron overloading/acute phase (ferritin) or abnormalities in vitamin B12 binding proteins (eg as seen in some cancers [B12]). Therefore, accurate and subgroup-specific RIs should be applied.
The aim of the present study is to establish RIs for ferritin and B12 using a modified Hoffmann’s approach.1
Modified Hoffmann’s method
In 1963, Hoffmann described a simple, indirect method of calculating RIs using existing patient data from a laboratory database, named the ‘probability paper method’.2 Later, the first computerised software based on Hoffmann’s approach was developed.3
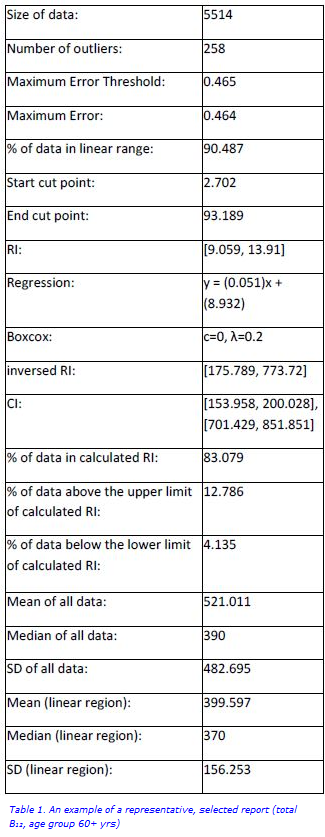
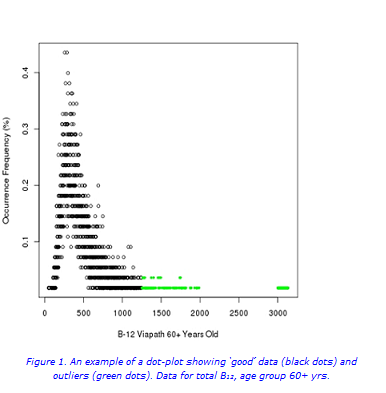
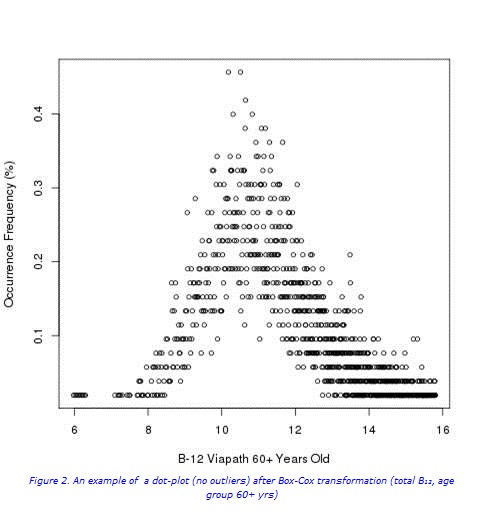
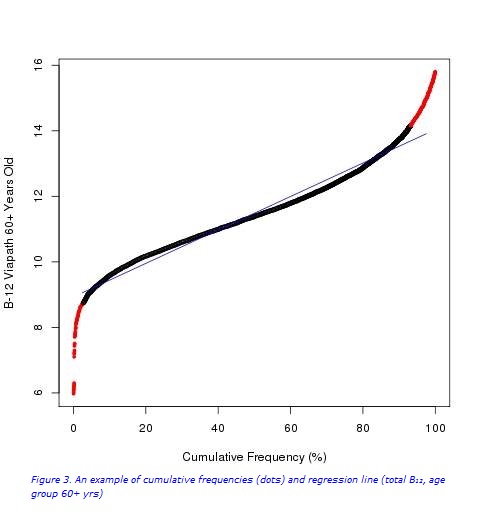
In brief, Chauvenet’s criteria were used for the detection of outliers (Figure 1a). Following the removal of outliers (Figures 1b and 2), the cumulative frequency of each test result was determined. Values from the linear portion of the cumulative frequency graph were used for computing the best fitting linear regression equation, γi=α*χ+β+εi (Figure 3). The RIs were then determined from the linear regression equation following extrapolation of the preceding curve, and calculated (for x=2.5% and 97.5%): RImin= α*2.5+β, RImax= α*97.5+β.
When the source data distribution is significantly skewed, a Box-Cox transformation may be applied (Figure 2), with back transformation after the linear portion is calculated from the transformed data. In this work, a fully computerised and validated method, with new functions and algorithms added, was used.
Methodology
All ferritin results processed between August 2014 and July 2015, and B12 results processed between January and June 2013 on the i2000SR (Abbott Diagnostics) from a population served by Guy’s and St. Thomas’ hospitals in London, UK, were used to calculate RIs. Data were partitioned in accordance with literature-based knowledge about gender/age-related differences in these markers.
Results
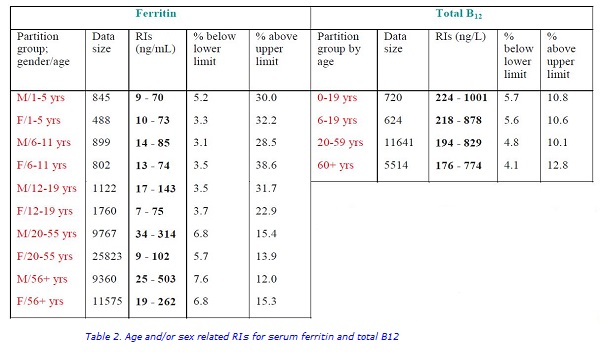
The RIs with percentage of values below and above the cut-offs are shown in Table 1. Owing to low sample numbers, separate RIs for the 0–12 months age group for ferritin and for the 0–5 years age group for B12 were not calculated (Table 2). A combined RI for B12 for the 0–19 years age group was calculated (inclusive of 96 patients aged 0–5 years).
Discussion
The RIs for serum ferritin and B12, calculated using a modified Hoffmann’s approach are consistent with RIs established using harmonized methods and may serve as universal RIs for other laboratories using the same methodology. They incorporate variations related to age, gender, method and the population being tested. The variations in upper limits for ferritin are of particular interest in view of iron overloading and deserve further investigations. Application of these RIs can assist with a better assessment of iron and vitamin B12 status.
References
- Katayev A, Fleming JK, Luo D, Fisher AH, Sharp TM. Reference intervals data mining: no longer a probability paper method. Am.J.Clin.Pathol 2015; 143 (1): 134–42.
- Hoffmann RG. Statistics in the practice of medicine. JAMA 1963; 185: 864–73.
- Katayev A, Balciza C, Seccombe DW. Establishing reference intervals for clinical laboratory test results: is there a better way? Am.J.Clin.Pathol 2010; 133 (2): 180–6.